

Engineering
Rethinking Data Pipelines
Published: July 13, 2023
Share this post

Cosmos
Back in the early 2000s, Microsoft started a project for highly reliable storage of user mailboxes in Hotmail. This was later incubated as Cosmos into their Bing division in 2005. It had a Clientlib for users to handcraft distributed computations over massively growing datasets. Soon they came up with a Nebula algebra to define stages of computations, which was eventually executed using Dryad, and later Perl-SQL to generate the Nebula file from SQL and Perl fragments. This was followed by DiscoSQL to drag and drop stages together, instead of writing scripts, using a GUI.
Ultimately, by the end of a decade since its origin, data processing in Cosmos turned into a modern compilation and query processing platform called SCOPE (abbreviation for Structured Computations Optimized for Parallel Execution). SCOPE supports both SQL operators and custom operators in C#, Java, Python, and R. Today, Cosmos powers every single business unit at Microsoft, processing hundreds of thousands of jobs, running over hundreds of thousands of machines, and individual jobs that can consume tens of petabytes of data and run millions of tasks in parallel!
The journey of Cosmos from manually handcrafted data processing stages to a declarative and optimized query processing platform is now being replayed in many new data transformation and pipelining tools today.
The Pipeline-Verse
Data pipelines have become ubiquitous in the modern data stack, especially with the popularity of ELT architectures, where the transformation step is done once the data lands into a data warehouse. Consequently, several new tools, such as Fivetran, DBT, and Airflow, have become popular for copying data, modeling data, and building workflows on top of data. Specifically, Airflow has emerged as one of the most popular data pipeline tools in recent years. Given that it is open-source, users can run it on their own compute nodes. However, Airflow is also available as a managed service on all major cloud providers, e.g., Google Composer on GCP, Managed Workflow for Apache Airflow on AWS, and Azure Data Factory Managed Airflow on Azure. In addition, members from the Airflow open-source community have spun up their own managed Airflow service, called Astronomer, which is also available on all clouds.
The Effort Required
As per the 2022 survey of the Airflow user community, 62% of the users have between 11–250 DAGs in their largest instance and 61% of the users have more than 25 tasks in their largest DAG. The pie chart below shows the full distribution of maximum number of tasks in single DAG, as reported by the Airflow users.
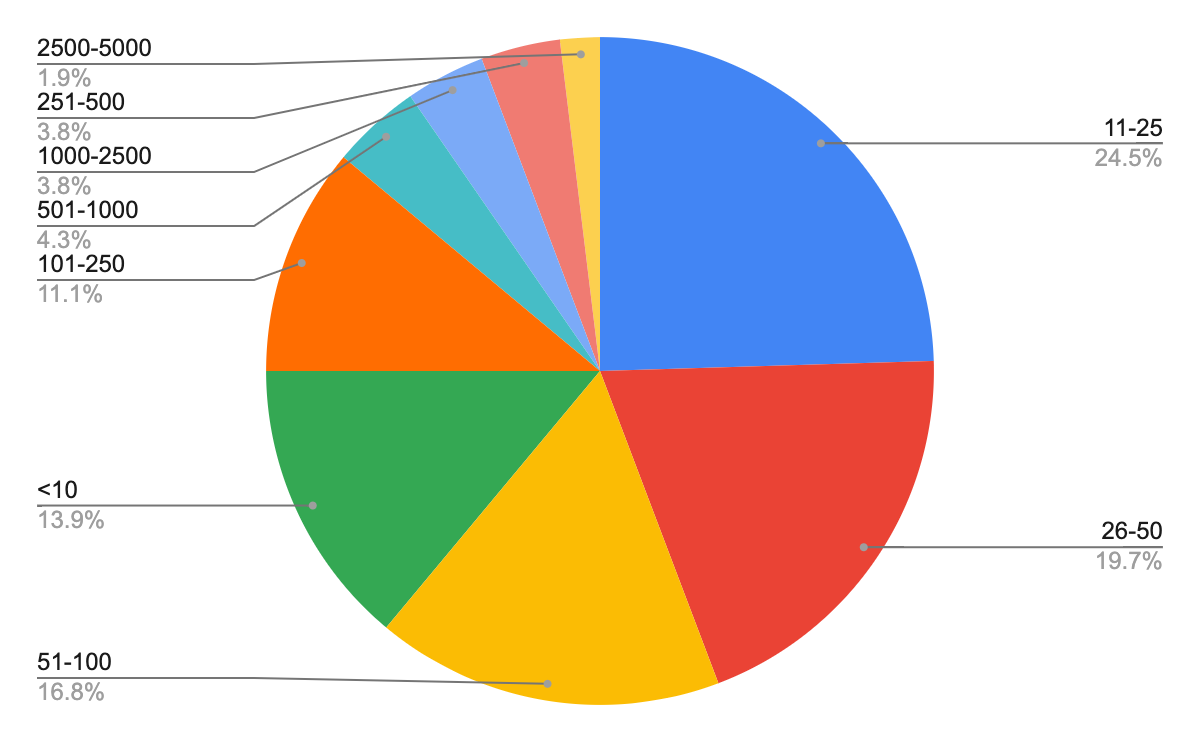
Maximum number of tasks used in a single DAG. Source: Airflow Survey 2022
We can see a serious amount of manual work in creating and maintaining complex workflows, laden onto the data teams of sizable organizations. This is further confirmed in DBT’s State of Analytics Engineering Survey of 2023, where most 66% of the respondents identified maintaining datasets as the most time consuming activity.

How data teams spend most of their time. Source: DBT Survey 2023
Data pipeline tools require the data engineer, or the analytics engineer, to specify the various stages in data transformation and stitch them together into a pipeline. The process is manual and can easily run into weeks or months. It also requires several iterations to refine and improve the pipelines for serving the business and efficiency needs.
The question therefore is whether manual stitching of pipelines will also evolve into a declarative system, like how data processing on Cosmos evolved into SCOPE. It took Cosmos roughly a decade, and given that Airflow debuted in 2015, will it become declarative by 2025?
Performance Gap
In addition to the growing complexity of the data pipelines that are hard to handle manually, there is also a significant performance gap that users can end up leaving on the table. To illustrate, consider Apache Superset, where it is typical practice to combine multiple tables using Saved Queries. Users can build one or more charts on top of these saved queries. Users can schedule the saved queries (the data pipeline) so that the data is appropriately fresh for all consumers, which is often very tricky. Alternatively, saved queries can be executed directly every time a chart is refreshed. However, the direct query could be 12x slower compared to the optimally scheduled one, as shown in the comparison below.
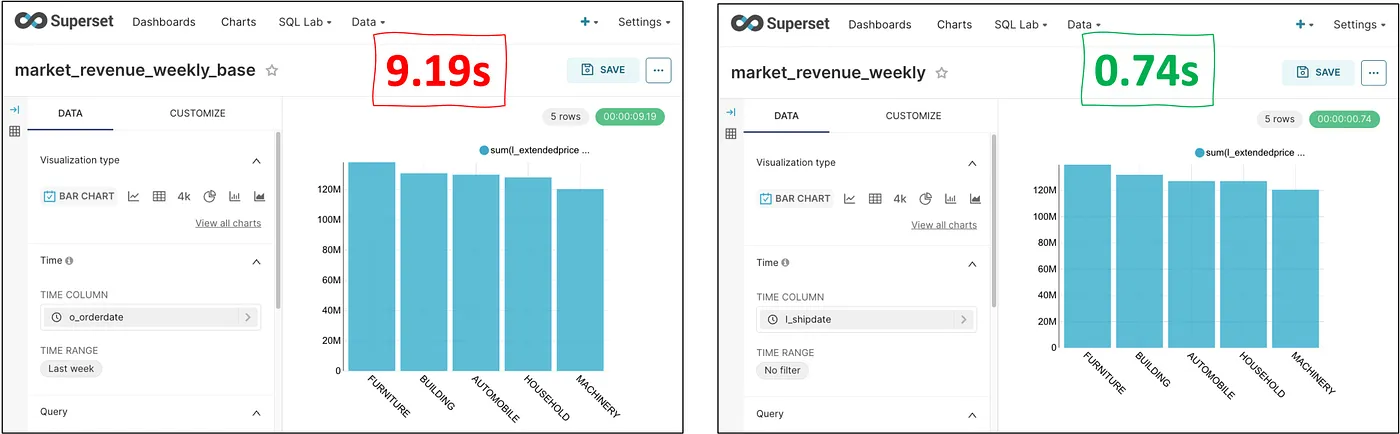
Comparing performance of manual and optimized data models on Apache Superset.
We can see that it is difficult for the analysts to build the optimized data pipelines manually and they are likely to leave a lot of performance on the table. Analysts spending time to build the right data transformation pipelines before delivering the dashboards will delay the time to insights. Furthermore, data pipelines need constant updates and re-optimization with newer dashboards, leading the data team into a constant disarray.
Similar data pipeline constructs exist in most analytics and reporting tools out there today, including Extracts in Tableau, Imports in Power BI, Persistent Derived Tables in Looker, Preferred Tables in BigQuery, SPICE in QuickSight, and so on. These are in addition to various engine-side tools to build generic data pipelines, e.g., Databricks pipelines, Snowflake tasks and DAGs, or simply the plain old, materialized views. Leveraging these tools and getting good performance out of them requires a tremendous amount of expertise and effort.
Cost Differences
Apart from performance, data pipelines can quickly add up the costs since they do the heavy lifting of moving and transforming data in bulk. The data teams need to pay close attention to consolidate pipelines, avoid redundant work, and constantly explore opportunities to optimize for lower costs. The cost problem grows exponentially with the size of the organization due to the combinatorial nature of data sources and applications. To illustrate the difference in cost that organizations can see, consider a data modeling pipeline for filter-aggregate queries on the TPC-H dataset. The figure below compares the total Airflow runtime, query time, and bytes processed in the naive (Base) and optimized (SmartApps) approaches.
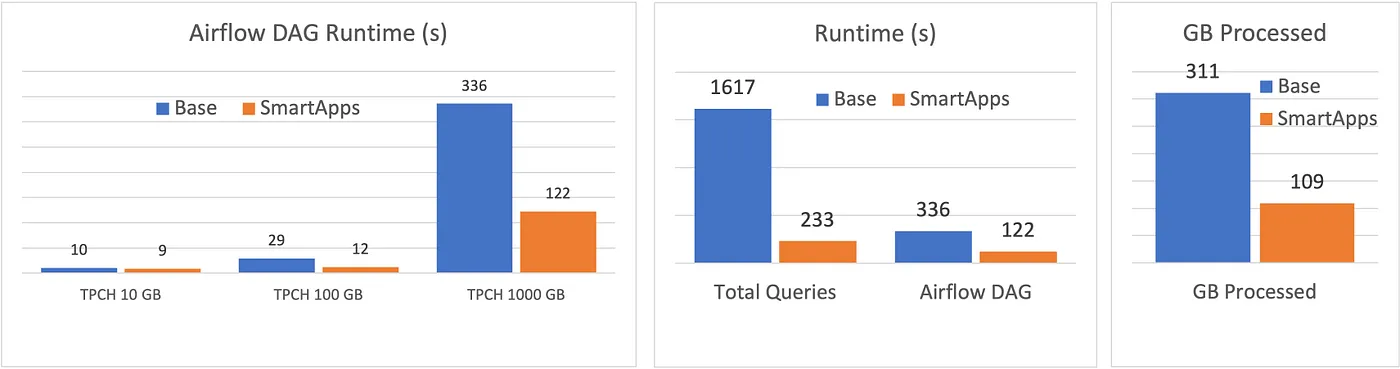
Comparing the performance of manual and optimized data models on TPC-H.
We see that the overall Airflow DAG runtimes are 3x faster on 1TB, while the cumulative query runtime is 7x faster and the total bytes processed is 3x less with the well-crafted optimizer. Constantly doing manual optimizations to deliver the above performance is hard for the data team.
Towards a Generative Approach
At SmartApps, we have taken a generative approach to data pipelines, where users ask questions, and the system takes care of automatically generating all required data pipelines while keeping them optimized for performance and cost at all times. As a result, users focus on “what” while the system figures out the “how” part. This also means that pipelines are like physical execution plans, i.e., the implementation details of a declarative system, just like in Microsoft Cosmos!
Related blog posts

Analyzing MCP Token Costs
MCP token costs depend more on architecture than on which LLM you pick — a comparative analysis and a forecasting tool to understand token costs better.
Read more

The Context Structuring Problem
Enterprise AI is only as good as its context — but today that context is scattered across prompt files, skill markdowns, and ad hoc RAG pipelines that every team rebuilds from scratch.
Read more

Making MCPs Practical with Context Pushdown
Traditional MCPs have a twist the moment you try to run them in production: they can be unreliable, expensive, and slow.
Read more
Bring search to your
workflows
workflows
See how Tursio helps you work faster, smarter, and more securely.


Data protection
'/%3e%3c/g%3e%3cdefs%3e%3clinearGradient%20id='paint0_linear_7851_102227'%20x1='0'%20y1='174.933'%20x2='1312'%20y2='174.933'%20gradientUnits='userSpaceOnUse'%3e%3cstop%20stop-color='%231E4EC4'/%3e%3cstop%20offset='0.8'%20stop-color='%230D6EFD'/%3e%3cstop%20offset='1'%20stop-color='%235BC0EB'/%3e%3c/linearGradient%3e%3c/defs%3e%3c/svg%3e)