

Generative AI
Remember That Time is Money
Published: April 19, 2023
Share this post

Benjamin Franklin famously said this in his “Advice to a Young Tradesman” more than two centuries ago in 1748 to convey the opportunity cost of laziness. The phrase can be further traced back to The Free Thinker newspaper in 1719 referring to a woman advising her husband on the sense of urgency in his shoemaking business. Even the earliest use of the term “business intelligence” was back in 1865 when banker Sir Henry Furnese gained profit by receiving and acting upon information about his environment, prior to his competitors:
“Throughout Holland, Flanders, France, and Germany, he maintained a complete and perfect train of business intelligence. The news of the many battles fought was thus received first by him, and the fall of Namur added to his profits, owing to his early receipt of the news.” — Devens, p. 210
These anecdotes serve as a reminder on how time has been always critical to businesses and better use of time means more profitable business.
Time-to-Insights: The New Money
Today when modern businesses run on data, time-to-insights on the data is the new money and there is a direct monetary cost to being lazy (or delayed) with data insights. Timely insights can help optimize processes, uncover opportunities, improve experiences, maximize profits, and make strategic decisions. And yet, consuming data from a data source and turning it into insights remains a challenge. At SmartApps, we ran a survey asking people who build analytics applications how long it takes them to build a dashboard and how long it takes to optimize it for their scenario. The two pie charts below show the results.
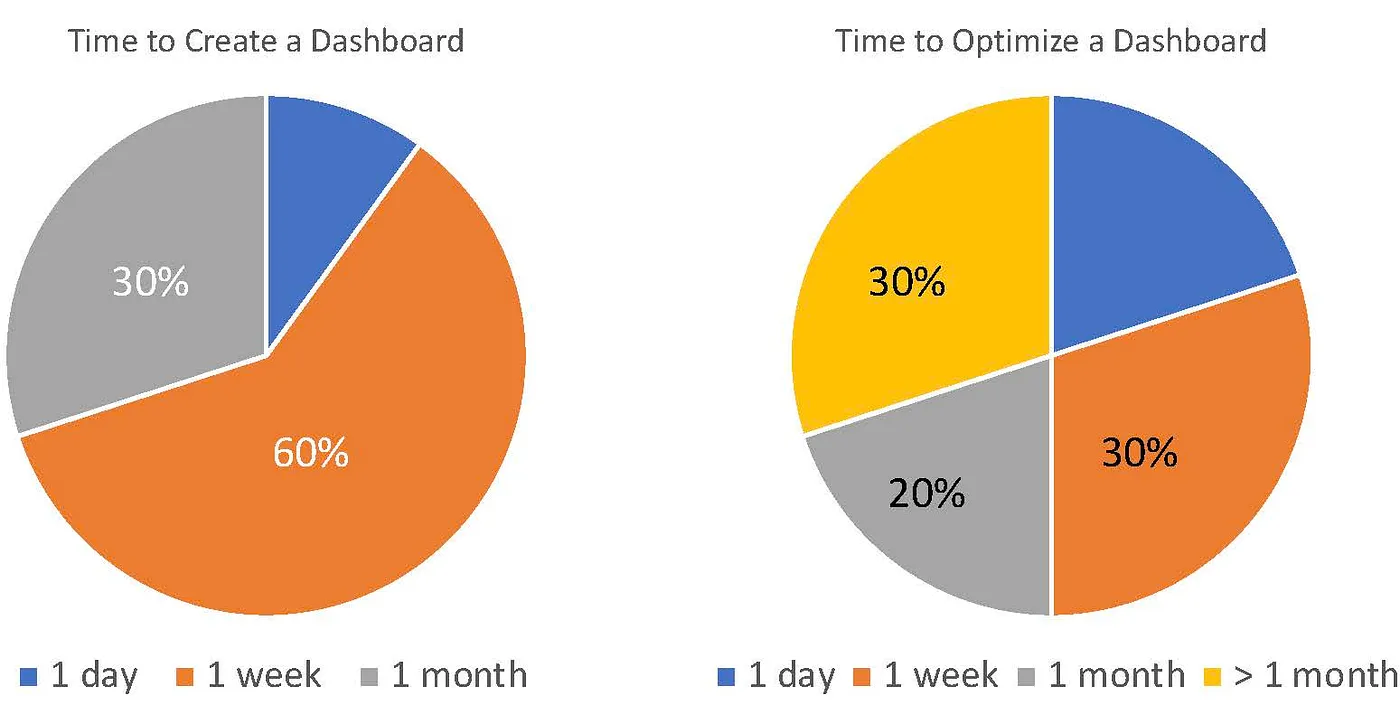
Figure 1: Results of the survey of data analysts and application builders.
Ninety percent of the people take 1 week or more to create a dashboard, and eighty percent of the people take 1 month or more to optimize their dashboards. This is after the data has already landed in a data warehouse. While this was shocking to us initially, more application builders corroborated such an experience in our interviews. Infact, a quick search on the internet also reveals a similar ordeal that people must go through:

Figure 2: A user sharing their experiences with Power BI

Figure 3: A user sharing their experience with Tableau.
We see that analysts routinely spend a lot of time on both data and visualizations, leading to a loss of productivity and business value. This is because the data and application platforms remain siloed, and transforming data into models that can power applications requires a series of manual steps, including understanding schemas, gathering data distributions and statistics, doing basic exploration, building intuition, and deriving preliminary insights. Currently, tools render all these painfully manual and slow, wasting precious time with a high opportunity cost for any business.
“What” First, “How” Later!
The worst-case scenario for an analyst is to run an entire data marathon, transforming data from the data warehouse to the application, just to realize that the end user needs something else, thus re-running the marathon all over again. Instead, the analyst would like to first establish “what” they are looking for and whether it makes sense for the end users, i.e., meaningful and interesting (visual) insight from clean high-quality data. Only after the “what” part is established, do they want to operationalize it into updatable, scalable, and efficient model workflows. In other words, the analysts simply want to see before they believe. Current tools do not employ such an insight-oriented approach, with visualization being non-trivial in most cases, as evident in the reaction below:

Figure 4: A user sharing their experience with query result visualization.
Figma is a great example of development teams first figuring out “what” they want and iterating on the wireframe before fleshing it out. As a result, with Figma, product manages can first run mockups by the end users, understand whether their requirements are captured, and iterate on it several times before the dev teams start integrating it in the backend. Unfortunately, a Figma like approach for data analytics is missing where analysts could visualize what they want first before fiddling with the complex data models and workflows.
The other aspect of figuring out “what” before “how” is that one can consider multiple “how” to achieve a given “what” and pick the best one. Databases do this by providing a declarative query language (SQL), where users specify what they want, and using a query optimizer internally to figure out the best way to execute a given SQL query. Users do not have to worry about either the data layouts, partitioning, or indexing or the operator implementation, ordering, or parallelism. Declarative data processing is today the de facto standard. Another everyday example of declarative tasks is Google Maps, where users simply tell where they want to go and the map figures out the best route for them.
Generating Insights With “Large Data Model”
At SmartApps, we are building a pre-trained “large data model” so that analysts do not have to waste their time building data models, but they can instead focus on the “what” part and jump directly to insights. This generative approach reduces the overall time to insights from hours and days to minutes. Our current implementation, PikePlace, showcases this approach on the Snowflake data marketplace to generate insights over several marketplace datasets. The chart below shows the average latency over all requests that are received by the PikePlace servers.

We can see that average latency hovers between 6 and 200 milliseconds, with the average being under 100 milliseconds. Thus, the pre-trained “large data model” indeed delivers insights at lightning-fast speed.
Early reactions to Pike Place have been very encouraging:
“This shaves off first six hours of my data science tasks.”
“I can see this bringing down data analyst work from 3–4 days to a day.”
“You are turning analytics on its head.”
Our quest to learn “large data model” is just getting started, with a long way to go in front of us. Some of the challenges we see include fine-tuning the models quickly to any given schema, contextualizing insights, structured search, and data privacy and security. However, the guiding principle remains helping businesses minimize the opportunity cost of time-to-insights. Or in the words of Benjamin Franklin:
“In short, the Way to Wealth, if you desire it, is as plain as the Way to Market. It depends chiefly on two Words, Industry and Frugality; i.e. Waste neither Time nor Money, but make the best Use of both.” — Benjamin Franklin
To conclude, remember that time is money.
Related blog posts

Analyzing MCP Token Costs
MCP token costs depend more on architecture than on which LLM you pick — a comparative analysis and a forecasting tool to understand token costs better.
Read more

The Context Structuring Problem
Enterprise AI is only as good as its context — but today that context is scattered across prompt files, skill markdowns, and ad hoc RAG pipelines that every team rebuilds from scratch.
Read more

Making MCPs Practical with Context Pushdown
Traditional MCPs have a twist the moment you try to run them in production: they can be unreliable, expensive, and slow.
Read more
Bring search to your
workflows
workflows
See how Tursio helps you work faster, smarter, and more securely.


Data protection
'/%3e%3c/g%3e%3cdefs%3e%3clinearGradient%20id='paint0_linear_7851_102227'%20x1='0'%20y1='174.933'%20x2='1312'%20y2='174.933'%20gradientUnits='userSpaceOnUse'%3e%3cstop%20stop-color='%231E4EC4'/%3e%3cstop%20offset='0.8'%20stop-color='%230D6EFD'/%3e%3cstop%20offset='1'%20stop-color='%235BC0EB'/%3e%3c/linearGradient%3e%3c/defs%3e%3c/svg%3e)